Poster ID: FRI-203, EASL Congress 2024
ABSTRACT
Authors: Nikolai V. Naoumov1, Yayun Ren2, Elaine Chng2, Kutbuddin Akbary2, Dean Tai2, Jonathan A. Fallowfield3, Timothy J. Kendall3, David E. Kleiner4, Arun J. Sanyal5
1. Royal College of Physicians, London, United Kingdom
2. HistoIndex Pte Ltd, Singapore, Singapore
3. Institute for Regeneration and Repair, University of Edinburgh, Edinburgh, United Kingdom
4. National Cancer Institute, Bethesda, MD, United States
5. Division of Gastroenterology, Hepatology and Nutrition, Department of Internal Medicine, Virginia Commonwealth University, Richmond, VA, United States
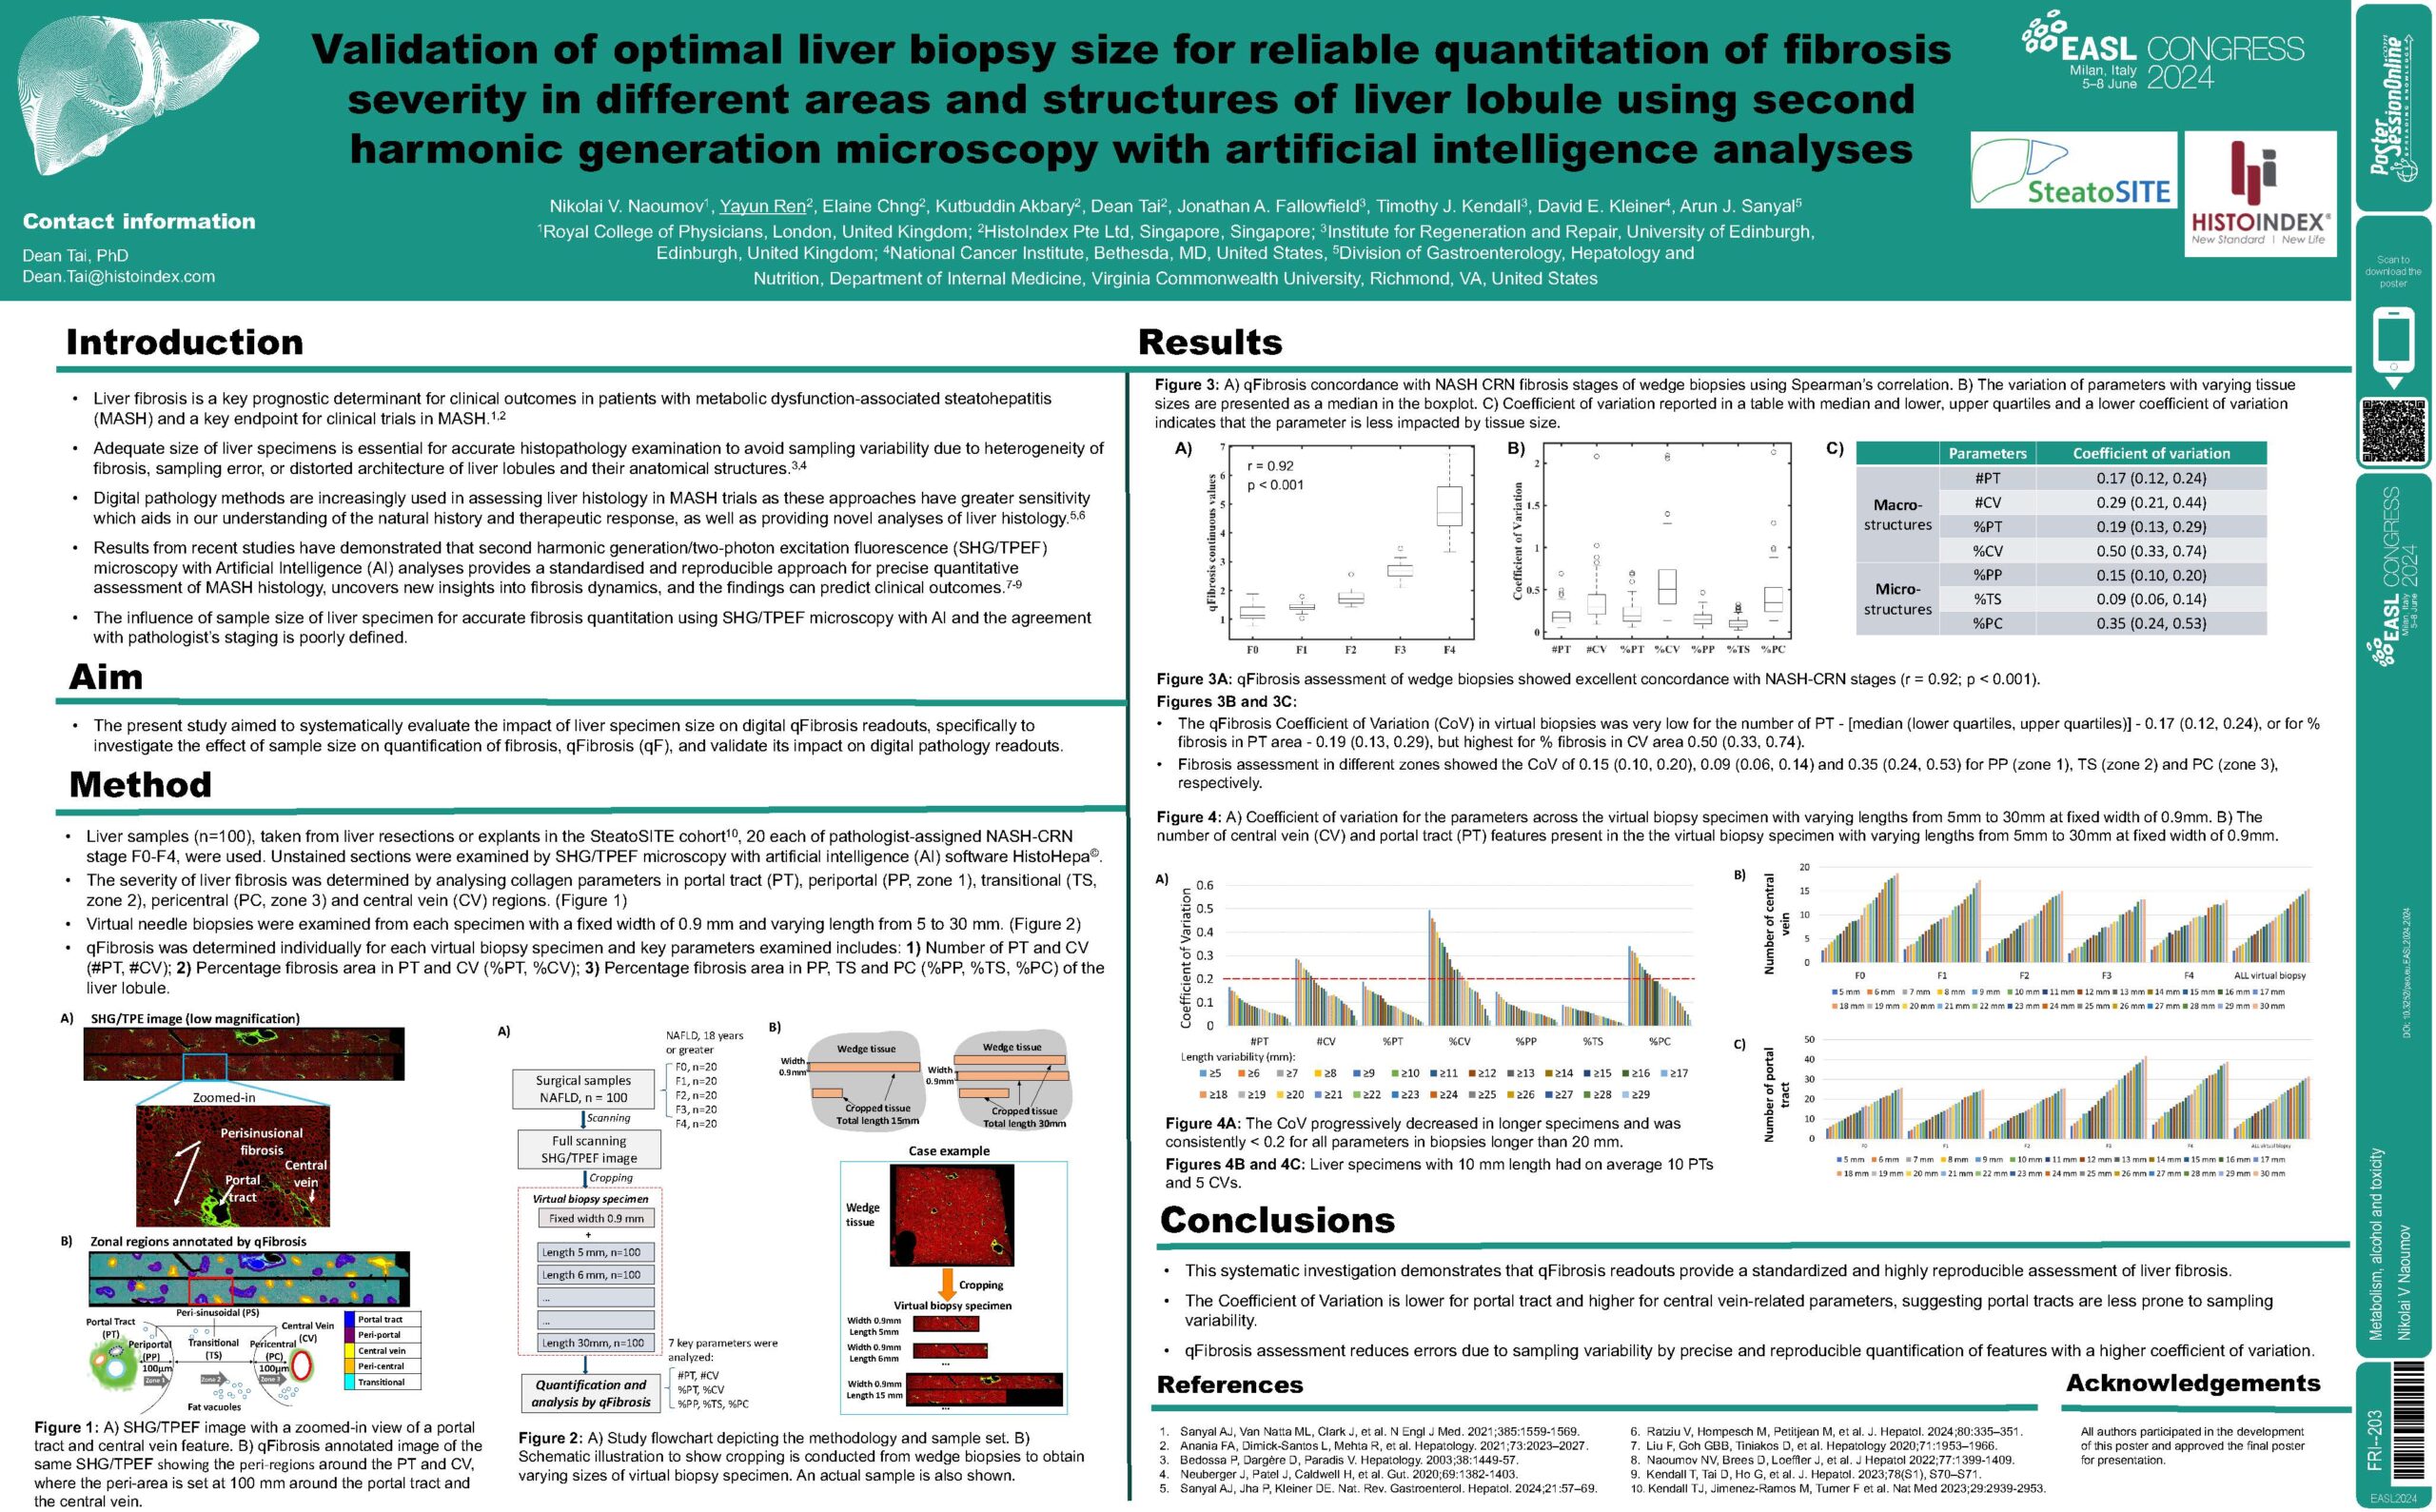
Background and Aims: Liver fibrosis is a key prognostic determinant for clinical outcomes in patients with metabolic dysfunction-associated steatohepatitis (MASH) and a key endpoint for clinical trials in MASH. Adequate size of liver specimens is essential for accurate histopathology examination to avoid sampling variability due to heterogeneity of fibrosis, sampling error, or distorted architecture of liver lobules and their anatomical structures. Digital pathology is increasingly used in MASH trials and provides greater sensitivity and precision in determining fibrosis dynamics, however, the influence of sample size on fibrosis quantitation using this technology and the agreement with pathologist’s staging is poorly defined. The present study aimed to systematically evaluate the impact of liver specimen size on digital qFibrosis readouts.
Method: Wedge biopsies (n=100) were obtained from liver resections or explants with 20 specimens for each pathologist’s determined NASH-CRN fibrosis stage F0 to F4. Unstained sections were examined by Second Harmonic Generation/Two Photon Excitation Fluorescence (SHG/TPEF) microscopy with artificial intelligence (AI) software HistoHepa©. The severity of liver fibrosis was determined by analyzing 184 fibrosis parameters in portal tract (PT), periportal (PP, zone 1), perisinusoidal (PS, zone 2), pericentral (PC, zone 3) and central vein (CV) regions. Virtual needle biopsies were examined from each specimen with a fixed width of 0.9 mm and varying length from 5 to 30 mm. qFibrosis was determined individually for each virtual biopsy specimen and key parameters included the number of PT and CV; % fibrosis area in PT and CV; % fibrosis area in PP, PS and PC (zone 1, 2 and 3) of the liver lobule.
Results: qFibrosis assessment of wedge biopsies showed excellent concordance with NASH-CRN stages (r = 0.92; p < 0.001). The qFibrosis Coefficient of Variation (CoV) in virtual biopsies was very low for the number of PT – [median (lower quartiles, upper quartiles)] – 0.17 (0.12, 0.24), or for % fibrosis in PT area – 0.19 (0.13, 0.29), but highest for % fibrosis in CV area 0.50 (0.33, 0.74). Fibrosis assessment in different zones showed the CoV of 0.15 (0.10, 0.20), 0.09 (0.06, 0.14) and 0.35 (0.24, 0.53) for PP (zone 1), PS (zone 2) and PC (zone 3), respectively. Liver specimens with 10 mm length had on average 10 PTs and 5 CVs. The CoV progressively decreased in longer specimens and was consistently < 0.2 for all parameters in biopsies longer than 20 mm.
Conclusion: qFibrosis readouts provide a standardized and highly reproducible assessment of liver fibrosis. The Coefficient of Variation is lower for PT and higher for CV-related parameters, indicating that portal tracts are less prone to sampling variability. qFibrosis assessment reduces errors due to sampling variability by precise and reproducible quantification of features with a higher Coefficient of Variation.

