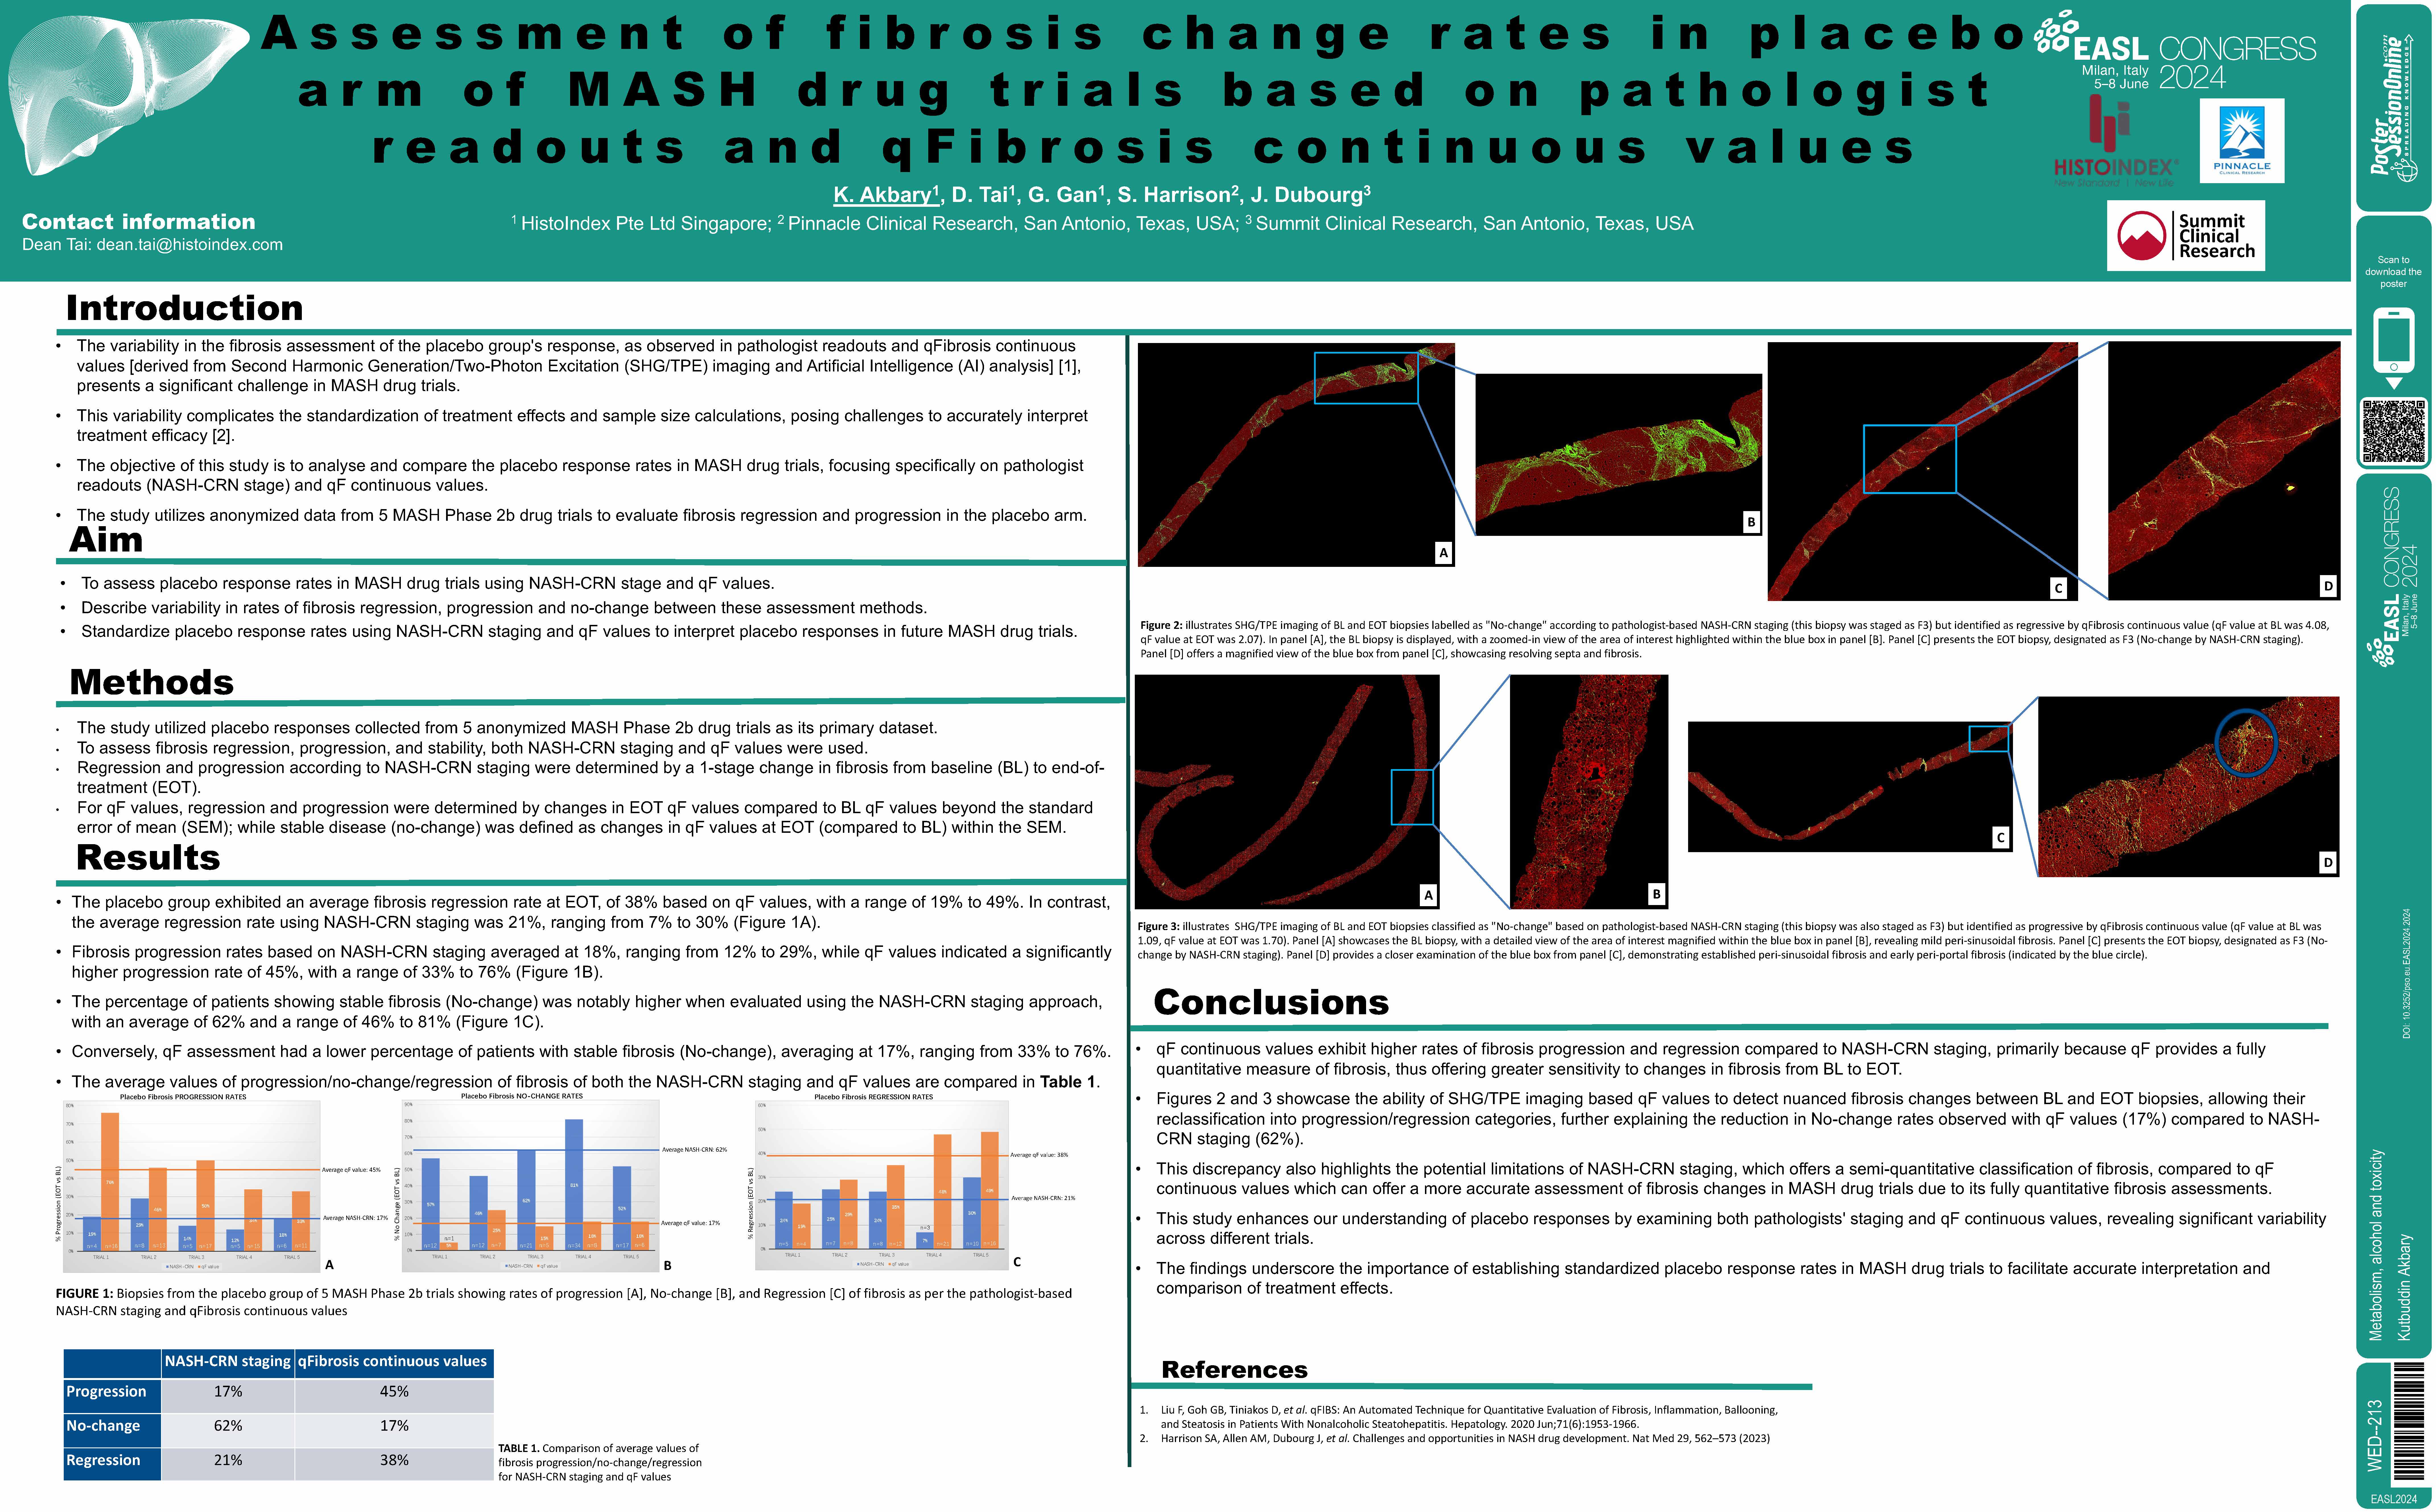
Poster ID: WED-213, EASL Congress 2024
ABSTRACT
Authors: Kutbuddin Akbary1, Dean Tai1, Galvin Gan1, Julie Dubourg2, Stephen A. Harrison3
1. HistoIndex Pte Ltd, Singapore, Singapore
2. Summit Clinical Research, San Antonio, TX, United States
3. Pinnacle Clinical Research, Radcliffe Department of Medicine, University of Oxford, Oxford, UK, San Antonio, TX, United States
Background and Aims: Metabolic dysfunction-associated Steatohepatitis (MASH) drug trials face challenges in assessing treatment response due to substantial variability in the placebo group, observed both in pathologist readouts and qFibrosis continuous values (qFc). This significant variability hinders standardizing treatment effect and sample size calculations in MASH clinical trials and challenges the interpretation of the “true” treatment effect. The placebo cohort allows for describing the natural course of the disease. This study aims to describe the placebo response rates in NASH drug trials, focusing on pathologist readouts (NASH-CRN stage) versus qF continuous values.
Method: Anonymized placebo responses from 5 MASH Phase 2b drug trials are detailed, using NASH-CRN readouts and qFc values. Fibrosis regression, progression, and no-change results are presented. NASH-CRN-based regression/progression was defined as a 1 stage change in fibrosis at end-of-treatment (EOT) compared to baseline (BL). qFc, regression/progression was determined based on the change in qFibrosis continuous values at EOT compared to BL, using the standard error of mean (SEM). No-change in qFc is change of qFc values within SEM at EOT compared to BL, and no-change in NASH-CRN stage in EOT compared to BL, respectively.
Results: Based on qFc values, the average fibrosis regression rate from BL to EOT in the placebo group was 38% (range: 19% – 49%), compared to an average regression rate of 21% (range: 7% – 30%) based on NASH-CRN staging. Fibrosis progression rates based on NASH-CRN averaged 18% (range: 12%-29%), contrasting with qFc at 45% (range: 33%-76%). The percentage of patients with stable diseases was higher when assessed by the NASH-CRN staging approach (average 62%, range: 46%-81%), compared to qFc (average: 17%, range: 33%-76%).
Conclusion: This study contributes to our understanding of the variance on placebo responses based on both pathologists’ staging and qF continuous values. The data underscores considerable variability in placebo response across different studies, reflected in pathologist staging and qFc values. The proportion of patients meeting the definition of progression or regression was higher when assessed by qFc values. As a result, qFc decreased the proportion of patients considering with no change in fibrosis. Both NASH CRN staging and qFibrosis-based continuous values are essential considerations in understanding placebo responses in MASH drug trials.

